7. Mathematical Formulations
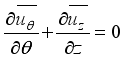
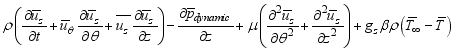
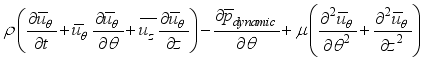
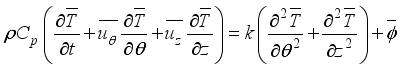
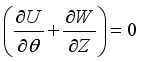
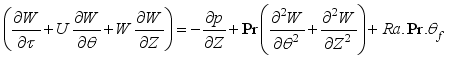
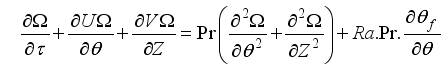
Let's discuss the equations that help us understand a 2-D cylindrical space. These include continuity, momentum in the theta & z directions, energy equations and k-omega SST equations.
v
(1)  (2)
(2)  (3)
(3)  (4)
(4) Where
Where
Transport Equation for Turbulent Kinetic Energy (k) is given as equation (
5) below
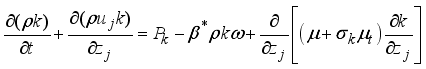 (5)
(5) Transport Equation for Specific Dissipation Rate (ω) is given in equation (
6) below
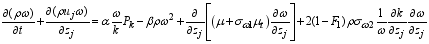 (6)
(6) Non-dimensionalization simplifies complex systems by removing units of measurement and expressing variables using dimensionless numbers. This reduces the number of parameters in equations, making it easier to understand the system’s behavior.
To do this non-dimensionalization, we use specific scaled variables
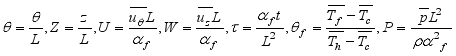 (7)
(7) Non-dimensionalized equations become
 (8)
(8)  (9)
(9) 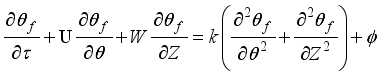 (10)
(10) Pr means the Turbulent Prandtl Number, while Ra stands for the Rayleigh Number.
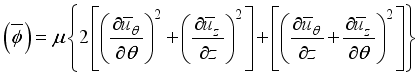
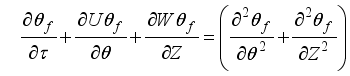
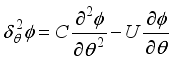
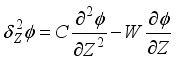
7.1. Equations in Vorticity Stream Function Form
In this section, the dimensionless governing equations are expressed in terms of the vorticity and stream function. This formulation eliminates the pressure term from the momentum equations, simplifying the analysis. Consequently, it enables the determination of velocity and temperature fields using the vorticity-stream function approach.
 (11)
(11) 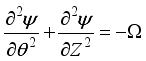 (12)
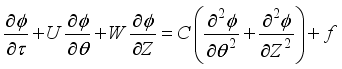
(12) 
+
 (13)
(13) Mathematical model
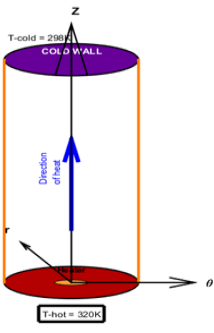
Figure 1. Geometry of the problem.
This is a schematic figure of the problem under study and its coordinates. The bottom side is hot (320k), and the top wall is maintained at (298k). The vertical walls are adiabatic. Since equations
11 and 13 are similar, they can be expressed as a single equation. Mobedi, M.
| [11] | Mobedi, M. (1994). A three-dimensional numerical study on natural convection heat transfer from rectangular fins on a horizontal surface Doctoral dissertation, Middle East Technical University. |
[11]
.
 (14)
(14) 7.2. Finite Difference Solution Technique
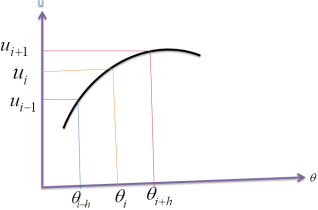
This method enables you to define the values of the dependent variables in an identified differential equation at any discrete location in the computational domain. The finite difference approach uses the Taylor series expansion to express a variable's derivatives as the differences between values at distinct points in space or time.
Figure 2 shows the change of 𝑢 with respect to

, that is 𝑢(

). After discretization, the curve (

) can be represented by a set of discrete points 𝑢′𝑠. These distinct points can be connected to one another via a Taylor series expansion. Consider two points (+ 1) and (𝑖 − 1).. a very small distance ∆

from central point denoted by (𝑖).
Figure 2. Location of points as per Taylor’s series.
The velocity

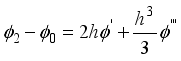
in the Taylor series expression about (𝑖) is:
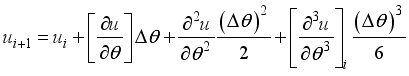 (15)
(15) and
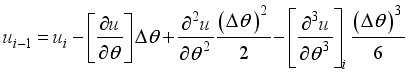 (16)
(16) If the number of terms is infinite but small, the derivative equation is mathematically precise. Expression of the second order accuracy and the truncation error is as below:
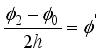
By subtracting equation
16 from equation
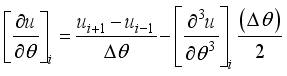
15, first and second derivatives at the central position 𝑖, these derivatives are
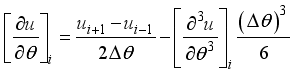 (17)
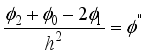
(17) And
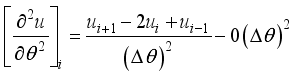 (18)
(18) Equation (
17) and (
18) are referred to as the central difference equation for the first and second derivatives respectively. Further derivatives can also be formed by considering equation
15 and equation
16 separately. Looking at equation
16 the first order derivative can be formed as
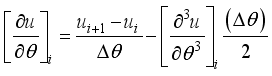 (19)
(19) This is known as the Forward difference. Similarly, from equation
15 and
16 another second order derivative can be formed as shown below
 (20)
(20) This is known as the backward difference.
A Finite Difference Method is distinguished by its approximation

and spatial
partial derivatives in the governing equation, which relate the values of the unknown function as a set of surrounding grid points at distinct time levels. This approximation substitutes the Partial Differential Equation (PDE) with a Finite Difference Equation (FDE). The process of replacing the PDE with an algebraic FDE is known as Finite Difference discretization or approximation. Finite Difference discretization consists of two steps: discretization of the solution domain and discretization of the governing equations.
7.2.1. Discretizing the Solution Domain
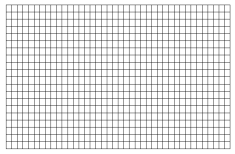
Turbulent natural convection in an enclosure is distinguished by a thin boundary layer along the walls, while the core is thermally stratified. The flow gradient in the boundary layer is very considerable, necessitating the use of a large number of grid points or computational nodes to calculate the values of dependent variables. The primitive variable is employed in this study; hence a staggered finite difference grid scheme is unnecessary. The solution's domain, or enclosure, is partitioned into a network of uniform rectangular grids with very fine spacing.
Figure 3. A two dimensional computational grid.
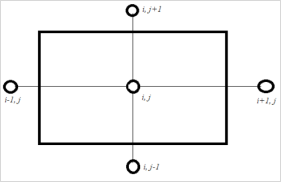
Figure 3 shows a two dimensional computational grid which is organized into small sections, each having a node at the middle. In a two-dimensional computational domain, each node (𝑖,) has four surrounding nodes, as seen in the diagram below.
Figure 4. A node of (i, j) with the neighboring nodes.
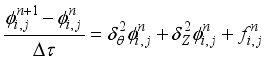
7.2.2. Discretizing the Governing Equations
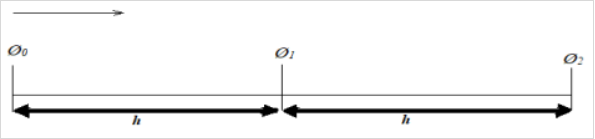
In order to create a system of linear algebraic equations that relate the value of the unknown function ∅ at the nodes, the governing equations must be substituted by a finite difference equation, which is the n applied successively at the internal nodes of the grid. Producing the values of the function ∅ at the nodes (𝑖) is the aim of PDE using the FDE.
Figure 5. A three- point difference approximation.
 (21)
(21)  (22)
(22) Finding the difference by Subtracting equation (
22) from equation (
21) yields
 (23)
(23) Making

the subject and rearranging
 (24)
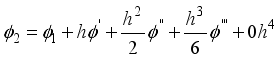
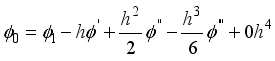
(24) Adding equation
21 to equation
22 gives
 (25)
(25) Making

the subject and rearranging
 (26)
(26) Where h is the spacing of the grid
By approximating the time derivative

using a first order backward difference approach about a grid point (𝑖,) at the time instant

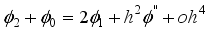
using Taylor's series expansion in 𝑡, we get
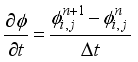 (27)
(27) Using Taylor's series expansions for approximating spatial derivatives with second-order centered difference, equation (
28) and equation (
29) are obtained as:
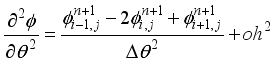 (28)
(28) and
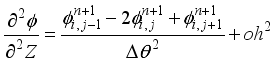 (29)
(29) The described approach is first-order accurate in time and second-order accurate in space. It approximates the spatial derivatives at a node, based on the dependent variable at the node and the neighboring cells, making this method change an n-equation differential equation into an n-equation algebraic one. The solution of this equation gives the value of the variable at the node. In the case of time-dependent problems, the domain has to be additionally discretized in time using a specified time step.
7.3. Finite Difference Solution Method for Parabolic Differential Equations
Equation
14 is reduced to;
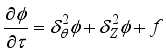 (30)
(30) Where
 (31)
(31)  (32)
(32) Diffusion and convection are important concepts. The term

is the diffusion and convection transport in

the direction while

referring to diffusion and convection transport in the Z direction.
There are several finite difference methods when it comes to solving parabolic partial differential equations. Usually, these methods can be organized into three main groups: the implicit, the explicit method, and Alternating Direction Implicit (ADI). For our study, we decided to go with the explicit method.
So, what makes the explicit method interesting, it moves through the dependent variable from one point to the next—node by node! However, this technique needs really small grid sizes or time intervals to stay stable. Because of that, it ends up needing a lot of computer storage and takes quite a bit of time to compute.
Applying the explicit method on equation
30 for any node (𝑖,) with a simple forward difference for the time term gives.
 (33)
(33) 7.4. Thermal Conditions at Boundary Points
1) The study comprises heating one wall at the base and cooling the upper section of the opposing one. Two thermal conditions were utilized.
2) For vertical walls, isothermal is expressed by the equation = Constant. Applicable to both the hot and cold walls is the Dirichlet boundary condition where Θhot = 1 and Θcold = 0.
3) Adiabatic: The remaining walls temperatures stayed consistent.
7.5. Velocity Conditions at the Boundary
Slippage has no frontier condition. Because the cohesive force is smaller than the adhesive force, the air particles near the surface won't follow the stream. At the solid boundary, then, viscous fluid will have velocity nil in relation to the wall. As a result, the outside molecules of the fluid stick to the surface it passes. On the surface therefore, 𝑢 = 𝑣 = 𝑤 = 0. Free slide's boundary condition is implemented. Every limit in this cylindrical container is thought to be impermeable. This means that mass cannot pass through an impermeable solid surface since the speed connected to the surface or boundary is zero.
8. Results and Discussion
Results are presented for the increase in aspect ratio (AR = 1, 2, 4, and 8) on natural convection in a vertical cylindrical enclosure for a constant Rayleigh number (Ra) in order to isolate the influence of geometry. With increasing aspect ratio (smaller diameter with fixed height), over which the domain is narrower and higher.
8.1. Result Showing Vector Plots of Velocity Magnitude
The results in this article were obtained by solving the governing equations numerically by using the finite difference method. Together with the boundary conditions imposed, these equations lead to numerical solutions for the model variables.
From the results, the flow field is divided into three distinct thermal regions: a hot region close to the heat source, a warm intermediate region, and a cold region near the cooling surface. These regions arise due to the natural convection currents driven by temperature gradients within the enclosure.
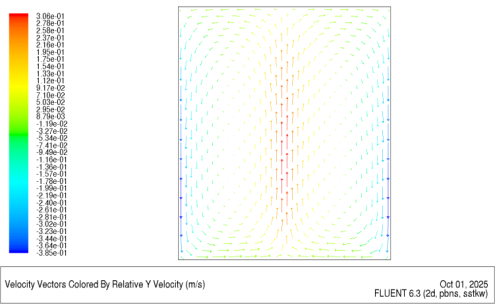
Figure 6. Vector plots of velocity magnitude for Aspect Ratio 1.
From
Figure 6 the provided vector field plot illustrates the natural convection phenomenon the cavity, driven by temperature differences and buoyancy forces. The central region of the cavity shows a concentration of upward velocity vectors, indicating that hot fluid rises vertically through the core due to its lower density. This rising motion is strongest near the bottom where the fluid is heated, as shown by the red region in the color map representing high velocity magnitudes. As the hot fluid ascends, the velocity gradually decreases, evident from the shortening of the arrows near the top surface, where the fluid begins to lose momentum. Meanwhile, cooler fluid near the side walls, being denser, descends along the vertical boundaries. These descending flows are characterized by longer arrows, showing acceleration as the fluid moves toward the heated bottom surface. This cycle forms a convection loop, where fluid circulates due to temperature-induced density variations. The entire motion is driven by a body force—gravity—acting on the buoyant fluid. The presence of a strong temperature gradient at the heated surface enhances the buoyancy effect, leading to more vigorous convection in the system.
This visualization clearly supports the observation that hot fluid rises, cold fluid sinks, and velocity patterns are strongly influenced by thermal gradients and gravitational forces.
The vector field and velocity magnitude plot represent a classic case of natural convection within an enclosed square cavity, driven by buoyancy forces arising from temperature-induced density gradients. When the bottom surface of the cavity is heated and the top or side surfaces are cooler, a temperature gradient is established within the fluid domain. As a result, the fluid near the heated surface gains thermal energy, becomes less dense, and rises vertically due to buoyant acceleration. This phenomenon is governed by the Boussinesq approximation, where density variations are considered only in the buoyancy term of the momentum equations. In
Figure 6 (AR = 1), the highest observed velocity is 0.306 m/s.
The central region of the cavity exhibits upward flow with the highest velocity magnitude, as shown by the densely packed and elongated vectors in the red-colored region of the plot. This confirms that hot fluid rises predominantly along the cavity’s vertical centerline. As this fluid ascends, its velocity decreases due to increasing viscous resistance and thermal diffusion, which is evident from the reduction in vector length and color gradient toward the top.
Simultaneously, the cooler fluid near the vertical sidewalls, being denser, sinks downward under the influence of gravity. This descending motion completes the convective circulation loop. The increased vector length near the sidewalls at the bottom indicates acceleration of the cold fluid as it approaches the hot surface, where it gets reheated and re-enters the upward convective core.
This convection pattern reflects a balance between buoyancy, viscous forces, and thermal diffusion. The strength of the flow is directly related to the magnitude of the temperature gradient—the stronger the gradient, the greater the buoyancy force, and hence, the more intense the convective motion. This flow regime is commonly described by the Rayleigh number (Ra), a dimensionless parameter that quantifies the relative influence of buoyancy to viscous forces in thermal convection systems.
In summary, the result scientifically demonstrates that natural convection in a cavity is driven by buoyancy forces resulting from temperature differences. Hot fluid rises at the center, cold fluid descends along the walls, and the velocity distribution confirms the development of a convective cell regulated by thermal gradients and gravity.
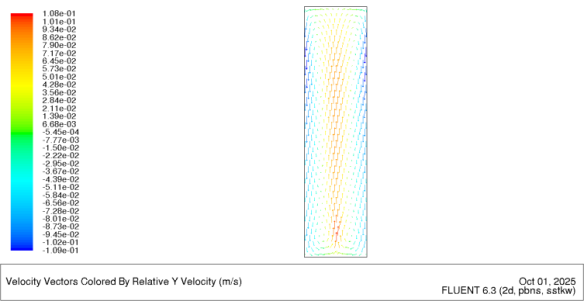
Figure 7. Vector plots of velocity magnitude for Aspect Ratio 2.
The vector plot for Aspect Ratio 2, as shown in
Figure 7, illustrates a well-defined natural convection pattern within a vertically elongated cavity. The plot reveals the formation of a single, vertically stretched convection cell characterized by strong upward flow of hot fluid along the central axis and downward flow of cooler fluid along the sidewalls. The highest velocity magnitudes are observed near the bottom-center region, where buoyancy forces are strongest due to the steep temperature gradient between the heated bottom surface and the surrounding cooler fluid. As the hot fluid rises, the velocity gradually decreases, as indicated by the shortening arrow lengths and the shift in color from red to green and blue, which reflects a reduction in momentum due to viscous and thermal diffusion effects. The descending cold fluid near the sidewalls accelerates under gravity, completing the convective loop. In particular, the maximum velocity slightly decreases to approximately 0.171 m/s, indicating a reduction in convective intensity compared to AR =1. The flow exhibits a vertically elongated single-cell circulation, with hot fluid rising along the center and cooler fluid descending near the vertical sidewalls. The highest velocity occurs near the bottom center, where thermal gradients are strongest, and gradually decreases with height due to viscous and thermal diffusion effects. The symmetry and structure of the velocity field indicate a stable, steady-state flow regime.
Figure 8. Vector plots of velocity magnitude for Aspect Ratio 4.
The vector plot of velocity magnitude for Aspect Ratio 4, as shown in
Figure 8, illustrates a well-developed circulation pattern within the vertical cylindrical enclosure. The highest velocity is 0.108 m/s. The flow vectors indicate that the heated and cooled walls generate strong convective currents, resulting in a pronounced upward motion of fluid along the heated side and a corresponding downward motion along the cooled side. The highest velocity magnitudes, depicted in red and orange shades, are concentrated near the central core and along the boundaries where thermal gradients are strongest, while the blue regions near the corners and lower portions of the enclosure exhibit weaker flow activity. This distribution signifies an enhanced convective motion and efficient heat transfer due to the increased height-to-diameter ratio, which allows the flow to develop more fully along the vertical direction.
Scientifically, the vector plot for Aspect Ratio 4 demonstrates that the flow within the vertical cylindrical enclosure is dominated by buoyancy-driven natural convection, where temperature-induced density gradients generate fluid motion. The heated wall causes the adjacent fluid to expand, decrease in density, and rise due to buoyant forces, while the fluid near the cooled wall becomes denser and descends, forming a stable counter-rotating circulation cell. The higher aspect ratio enhances the vertical temperature gradient and extends the path of thermal plumes, leading to a stronger and more elongated flow structure. The velocity magnitude distribution, with peak values near the core and boundary layers, indicates intensified thermal convection and efficient mixing, which promotes uniform heat distribution along the enclosure height. This behavior aligns with classical natural convection theory, where increasing the aspect ratio strengthens the convective motion and enhances overall heat transfer performance.
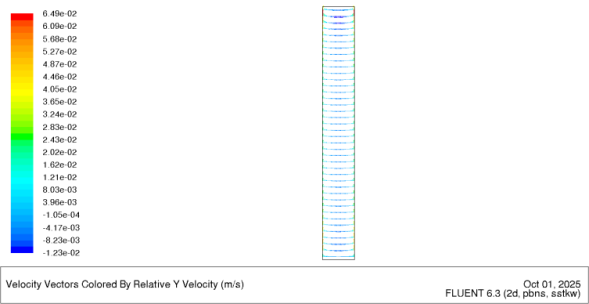
Figure 9. Vector plots of velocity magnitude for Aspect Ratio 8.
Figure 9 presents the vector plots of velocity magnitude for Aspect Ratio 8, showing a relatively elongated and slender flow structure compared to lower aspect ratios. The velocity is 0.06m/s. The flow vectors indicate that the fluid motion is weaker and more uniformly distributed along the vertical axis, with reduced circulation intensity. The velocity magnitude, as reflected by the color scale, shows lower peak values concentrated near the heated and cooled surfaces, while most of the domain exhibits mild velocity gradients. The flow appears predominantly laminar, with limited mixing in the central region, suggesting that the extended geometry constrains the lateral development of convection cells.
From a scientific standpoint, the reduced velocity magnitude and elongated pattern at Aspect Ratio 8 indicate that buoyancy-driven convection weakens as the height of the enclosure increases relative to its diameter. The vertical elongation causes thermal plumes to lose momentum before completing full circulation loops, resulting in diminished recirculation zones and weaker heat transfer. The flow becomes thermally stratified, with a dominant vertical component and reduced transverse mixing. This behavior aligns with natural convection theory, where excessively high aspect ratios lead to suppressed convective intensity due to limited horizontal temperature gradients and increased viscous damping, thereby reducing the overall efficiency of heat transport within the enclosure.
A detailed comparison of the velocity magnitudes in
Figures 6 through 9 reveals a consistent decline in maximum velocity with increasing aspect ratio. In
Figure 6 (AR = 1), the highest observed velocity is 0.306 m/s. As the aspect ratio increases to 2 (
Figure 7), the maximum velocity slightly decreases to 0.171 m/s. A more noticeable reduction is observed in
Figure 7 (AR = 4), where the velocity drops to 0.108 m/s. Finally,
Figure 9 (AR = 8) shows the lowest velocity of 0.06 m/s.
As the aspect ratio increases while maintaining a constant Rayleigh number, the natural convection circulation becomes increasingly weak. The taller and narrower domain stretches the flow vertically and restricts horizontal motion. This results in longer flow paths and increased viscous losses, which reduce the overall convective efficiency.
Furthermore, the narrow geometry limits the space available for the development of large recirculation cells, which are essential for effective heat transport. The confinement leads to greater thermal stratification, which suppresses vertical motion even more. These combined factors lead to a consistent and significant reduction in the maximum velocity as the aspect ratio increases from 1 to 8.
8.2. Contours of Temperature Distribution (𝒌)
Contour plot is a graphical tool used to represent scalar fields by connecting points of equal magnitude with continuous lines or curves. In the context of thermal analysis, isotherms are contour lines that represent regions of constant temperature. These plots are particularly useful in heat transfer studies because they make it possible to visualize how temperature varies spatially within a domain, providing insight into heat flow direction, intensity of gradients, and the relative importance of conduction and convection.
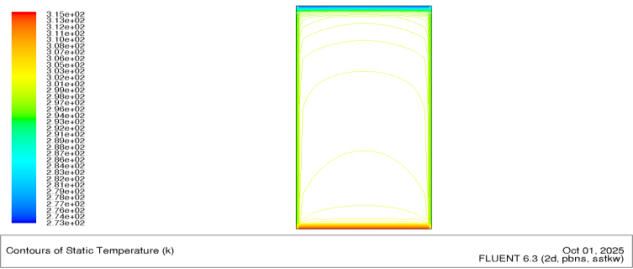
Figures 10 to 13 are used to present the temperature distribution in the central r- z plane of a vertical cylindrical enclosure for aspect ratios (AR) of 1, 2, 4, and 8, while keeping the cylinder height fixed at H = 2. The maximum temperatures recorded at the center of the enclosure for these cases are 318~K, 315~K, 305~K, and 300~K, respectively. The progression of these contours highlights how the thermal field evolves with geometry, shifting from strong radial circulation in squat enclosures toward predominantly vertical stratification in tall, slender ones.
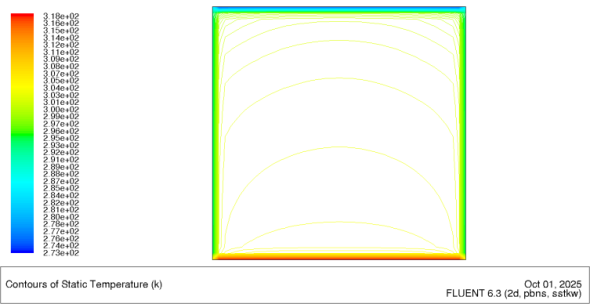
Figure 10. Contours of temperature distribution in a vertical cylinder with aspect ratio AR = 1.
In
Figure 10 the temperature contour plot shows the distribution of static temperature within the enclosure, revealing a well-defined thermal stratification pattern. The highest temperatures, represented by red and orange zones, are concentrated near the bottom heated surface, while the coolest regions, shown in blue and green, are located near the top boundary. The contour lines are densely packed near the lower wall, indicating steep temperature gradients and strong heat transfer due to buoyant motion. As the flow rises, the contours spread out, signifying a gradual reduction in temperature difference and weaker convection near the upper region. The smooth and symmetric shape of the contours suggests stable natural convection with a single dominant circulation cell facilitating upward heat transport from the heated base toward the cooler top surface.
Figure 11. Contours of temperature distribution in a vertical cylinder with aspect ratio AR = 2.
The temperature contour plot indicates intense mixing and enhanced heat transfer within the enclosure, with the highest temperature reaching approximately 318 K near the heated bottom wall. The tightly packed isotherms in this region signify strong thermal gradients and vigorous turbulent eddies that promote rapid energy exchange between fluid layers. Unlike laminar convection, where heat transfer occurs primarily through molecular diffusion, turbulence introduces fluctuating velocity components that enhance the effective thermal conductivity of the fluid. As a result, the temperature distribution becomes more uniform throughout the enclosure, as evidenced by the smoother temperature transitions toward the upper region. The contour pattern suggests that buoyancy-driven turbulence dominates near the heated surface, generating large-scale eddies that transport heat upward efficiently, while smaller dissipative eddies near the top region help stabilize the flow and maintain thermal equilibrium. This behavior is characteristic of turbulent natural convection, where chaotic motion significantly increases convective heat transfer efficiency compared to laminar flow conditions.
In
Figure 11, The temperature contour plot for Aspect Ratio (AR) = 2 shows that the maximum temperature reaches approximately 315 K near the heated wall. The isotherms are tightly packed adjacent to this surface, indicating strong thermal gradients and vigorous buoyancy-driven convection. As the heated fluid rises vertically, the temperature decreases progressively toward the cooler wall, producing a smooth and continuous gradient across the enclosure. The central zone displays moderately spaced contours, reflecting effective thermal mixing and stable circulation. Overall, the temperature distribution in
Figure 11 illustrates efficient natural convection, where heat is transferred upward and across the enclosure due to buoyancy effects, resulting in a well-developed and balanced thermal field for AR = 2.
This rising warm fluid is replaced by descending cooler fluid along the opposite wall, forming a continuous convective circulation. The densely packed isotherms near the heated surface signify a strong temperature gradient and high local heat flux, while the wider spacing toward the enclosure’s core indicates efficient mixing and diffusion of heat by turbulent eddies. The relatively uniform temperature field in the central region demonstrates enhanced thermal transport caused by turbulent fluctuations, which increase the effective thermal diffusivity of the fluid. Thus, at AR = 2, the flow exhibits a stable yet vigorous convective regime, maximizing heat transfer through the combined effects of buoyancy and turbulent mixing.
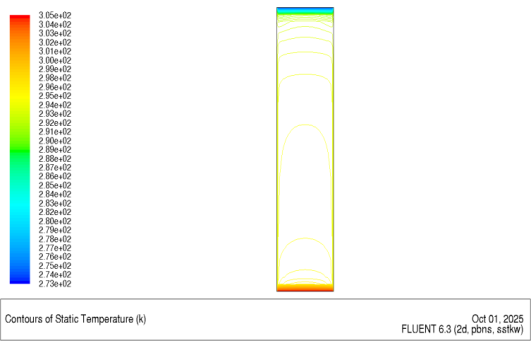
Figure 12. Contours of temperature distribution in a vertical cylinder with aspect ratio AR = 4.
Figure 12 for Aspect Ratio (AR) = 4, the temperature contour plot shows that the highest temperature is approximately 305 K near the heated wall. The isotherms are densely packed at the lower region close to the heat source, indicating strong temperature gradients and active heat transfer. As the fluid rises vertically along the heated surface, the contours gradually spread out, reflecting a steady decrease in temperature toward the upper region and the cooled wall. The central zone displays moderately spaced contours, suggesting effective thermal mixing due to buoyancy-driven motion. Overall, the temperature distribution is smooth and vertically elongated, showing that heat is efficiently transferred upward through natural convection within the enclosure.
The flow behavior is dominated by buoyancy-driven turbulent natural convection, where the heated fluid rises along the hot surface while cooler fluid descends along the opposite wall, forming a vertically elongated circulation cell. The tightly packed isotherms near the heated wall signify steep thermal gradients and strong local heat transfer, while the more widely spaced contours toward the center and upper region indicate efficient thermal mixing caused by turbulence. The increased height of the enclosure enhances the vertical movement of thermal plumes, allowing more developed convective structures to form. Turbulent eddies play a significant role in redistributing heat, leading to a smoother temperature field and improved heat transport efficiency. Overall, at AR = 4, the flow demonstrates intensified buoyancy effects and enhanced convective heat transfer compared to lower aspect ratios.
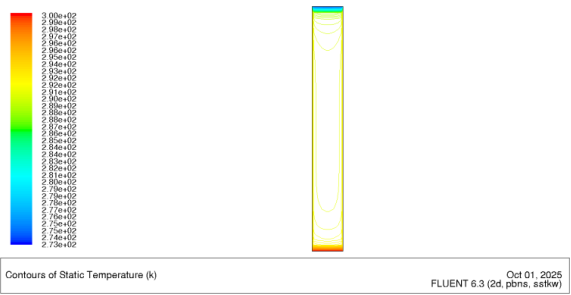
Figure 13. Contours of temperature distribution in a vertical cylinder with aspect ratio AR =8.
For Aspect Ratio (AR) = 8, the temperature contour plot shows that the highest temperature is approximately 300~K near the heated wall at the lower region of the enclosure. The isotherms are relatively sparse and vertically stretched, indicating weaker temperature gradients and reduced convective intensity compared to lower aspect ratios. The fluid motion appears more stratified, with minimal mixing in the central zone and a gradual temperature decrease toward the cooled wall. The upper region of the enclosure exhibits nearly parallel isotherms, signifying a stable thermal layer and diminished turbulence. Overall, the temperature distribution demonstrates that as the aspect ratio increases, convection weakens, leading to reduced heat transfer efficiency and a more uniform but less dynamic thermal field.
When the height (H) is kept constant, the temperature contour plot demonstrates the effects of increasing enclosure slenderness by reducing the diameter while maintaining the same vertical dimension. The maximum temperature of approximately 300~K near the heated wall indicates weaker thermal gradients and reduced convective strength. Since height is constant, the increase in aspect ratio primarily alters the lateral heat transfer path, resulting in a narrower flow domain where buoyancy-driven circulation becomes less effective. The elongated and widely spaced isotherms show that the flow is more thermally stratified, with limited horizontal mixing and reduced turbulent intensity. The hot fluid rises slowly along the heated wall and cools gradually as it moves upward, reflecting a diminished convective heat transfer rate. Overall, at AR = 8, the constant height condition results in weaker buoyant motion and lower heat transport efficiency due to restricted lateral flow and enhanced thermal stability.
In summary, within a vertical cylindrical enclosure, increasing the aspect ratio (by reducing the diameter while keeping height constant) enhances vertical stratification and weakens radial convective mixing. This leads to progressively lower maximum temperatures, reducing from approximately 318~K at AR = 1 to 300~K at AR = 8.
8.3. Contours of Effective Thermal Conductivity
The Contours of Effective Thermal Conductivity illustrate the spatial variation of heat transfer intensity within the vertical cylindrical enclosure. They depict regions where convective and conductive heat transfer mechanisms dominate under the influence of buoyancy-driven flow. The distribution provides insight into how natural convection enhances the overall thermal performance of the system.
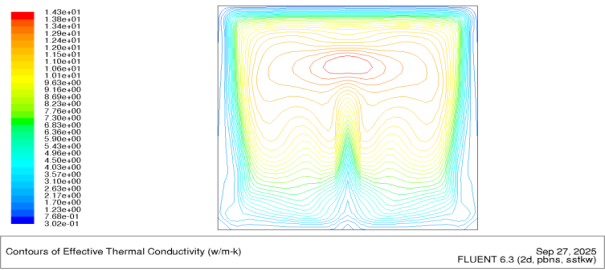
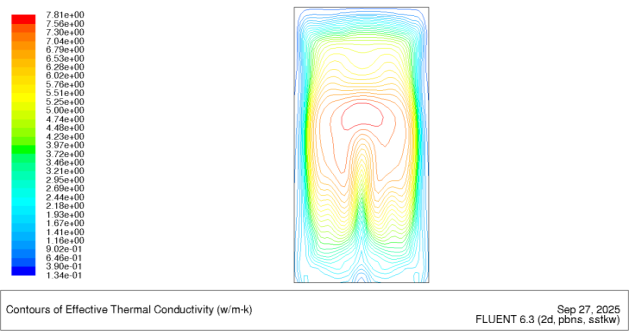
Figure 14. Contours Effective thermal conductivity for Aspect Ratio 1.
The contour plot of effective thermal conductivity for an aspect ratio (AR) of 1 shows a symmetric distribution of heat transfer characteristics within the square cavity. The effective thermal conductivity reaches its maximum value of approximately 14.3 W/m·K in the central upper region, where strong buoyancy-driven convection enhances heat transport. This zone is represented by densely packed red contours, indicating steep thermal gradients and high thermal activity. On the other hand, the minimum values of about 0.1 W/m·K occur near the bottom corners and along the vertical sidewalls, where circulation is weak and diffusion dominates the heat transfer. The symmetric contour patterns further reveal the influence of convection cells, with hot fluid rising through the central region and cooler fluid descending along the sides, forming a recirculating motion. Overall, for AR = 1, the plot demonstrates that convection plays a dominant role in enhancing effective thermal conductivity at the core, while boundary regions are characterized by weaker diffusion-controlled heat transfer.
Figure 15. Contours Effective thermal conductivity for Aspect Ratio 1.
For an aspect ratio of 1 with the bottom wall heated at 320~K and the top wall cooled at 298~K, the 22~K temperature difference generates buoyancy-driven natural convection that strongly influences the distribution of effective thermal conductivity within the cavity. The heated fluid at the bottom becomes lighter and rises through the central region, forming an upward thermal plume, while the cooled fluid at the top becomes denser and sinks along the sidewalls, resulting in two symmetric counter-rotating convection cells. This circulation enhances heat transport in the central plume region, where the effective thermal conductivity reaches its maximum 14.3~W/m·K due to vigorous mixing and steep temperature gradients. In contrast, the corners and sidewall regions show minimum values 0.1~W/m·K, where fluid motion is weak and heat transfer is dominated by conduction. The symmetric contour pattern reflects the uniform boundary conditions, and overall, the plot demonstrates how the applied thermal gradient (320~K bottom, 298~K top) drives natural convection that significantly augments effective thermal conductivity at the core while leaving boundary regions diffusion-dominated.
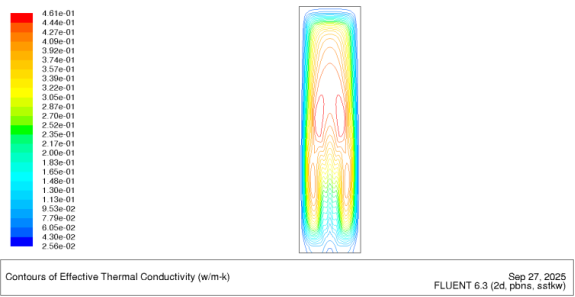
For the aspect ratio of 2 in
Figure 15 the contour plot of effective thermal conductivity shows an elongated vertical distribution of heat transfer, reflecting the influence of the taller cavity geometry. The maximum effective thermal conductivity, about 7.81 W/m·K, occurs in the central upper region, where the buoyancy-driven plume rises strongly from the heated bottom wall and encounters the cooled top wall, creating steep temperature gradients and enhancing thermal transport. Compared to the square cavity (AR = 1), the elongated domain constrains horizontal mixing and favors stronger vertical convection, leading to narrower and more vertically stretched contours. The sidewalls and bottom corners exhibit lower values of effective thermal conductivity (≈0.14 W/m·K), indicating zones dominated by conduction due to weak circulation. The symmetry of the contours about the vertical mid-plane confirms balanced boundary conditions, while the distinct upward plume and return downward flow along the walls highlight the dominant role of convection in vertically oriented cavities. Overall, the AR = 2 cavity demonstrates enhanced vertical convective transport and reduced lateral spreading of effective thermal conductivity compared to the square geometry.
From a scientific perspective, the effective thermal conductivity distribution for an aspect ratio of 2 can be explained by the coupled effects of buoyancy forces, geometry, and boundary conditions. The imposed temperature difference (320 K at the bottom and 298 K at the top) generates buoyant motion, with hot fluid rising from the heated base and cold fluid descending along the vertical walls. In a taller cavity, the vertical length scale increases, this enhances the Rayleigh number and strengthens vertical convection while limiting lateral mixing. This leads to an elongated thermal plume at the center, where the highest effective conductivity (≈7.81 W/m·K) occurs due to vigorous convective transport and sharp temperature gradients near the cooled top surface. By contrast, the sidewalls and bottom corners experience weaker circulation, producing conduction-dominated regions with low effective conductivity (0.14 W/m·K). The symmetry observed across the vertical mid-plane arises from the uniform thermal boundary conditions, resulting in two counter-rotating convection cells. Compared with AR = 1, the AR = 2 cavity demonstrates that increasing diameter intensifies vertical convective pathways but reduces lateral spreading, highlighting the strong dependence of natural convection heat transfer on aspect ratio.
Figure 16. Contours Effective thermal conductivity for Aspect Ratio 2.
In
Figure 16 the contour plot of effective thermal conductivity illustrates the heat transfer distribution within the vertical cylindrical enclosure. The results show a non-uniform pattern, with higher values concentrated along the central region, reaching approximately 0.461 W/m·K, indicating zones of strong convective activity. This enhancement arises from buoyancy-driven motion, which increases the effective heat transport within the fluid core. Near the sidewalls, lower conductivity values signify conduction-dominated regions characterized by steep temperature gradients and weak fluid motion. The nearly symmetrical contour distribution reflects balanced heating and cooling on opposite surfaces. Overall, convection enhances thermal conductivity in the core, while conduction prevails near the boundaries, forming a stable natural convection flow structure.
The contour plot of effective thermal conductivity provides a scientific representation of heat transfer behavior within the vertical cylindrical enclosure. The maximum value of approximately 0.461 W/m·K occurs along the central region, where buoyancy-induced convection significantly enhances energy transport. This increase in effective thermal conductivity reflects the strong coupling between thermal and momentum fields under natural convection. Near the sidewalls, lower conductivity values indicate conduction-dominated regions with steep temperature gradients and minimal fluid motion. The symmetrical distribution of contours along the vertical axis suggests balanced boundary conditions and stable convective circulation. Overall, the results confirm that convection enhances the effective thermal performance of the system by increasing the apparent thermal conductivity of the fluid.
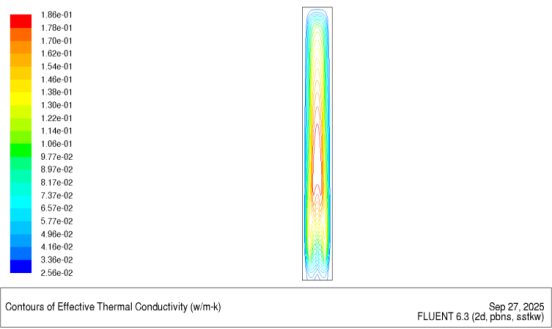
Figure 17. Contours Effective thermal conductivity for Aspect Ratio 8.
Figure 17 illustrates the contours of effective thermal conductivity for an aspect ratio of 8, showing a vertically stratified distribution within the cylindrical enclosure. The highest values of effective thermal conductivity, reaching approximately 0.186 W/m·K, are concentrated along the central region, indicating zones of strong convective enhancement due to buoyancy-driven fluid motion. In contrast, the regions near the sidewalls exhibit lower conductivity values, suggesting conduction-dominated areas characterized by steep temperature gradients and limited fluid motion. The contour lines display a nearly symmetrical distribution about the vertical axis, reflecting balanced heating and cooling conditions on opposite surfaces. Overall, the results show that convection enhances heat transfer within the core of the cylinder, while conduction remains dominant near the boundaries, producing a stable and well-defined natural convection flow pattern.
The maximum effective thermal conductivity of 0.186 W/m·K, occurs along the central region, signifying enhanced convective transport resulting from buoyancy-induced fluid motion. This indicates a strong coupling between thermal and velocity fields, where rising warm fluid and descending cool fluid intensify mixing and heat exchange. The lower conductivity values near the sidewalls correspond to conduction-dominated zones characterized by steep temperature gradients and suppressed fluid movement. The nearly symmetrical contour pattern along the vertical axis suggests that the heating and cooling boundaries generate a steady convective circulation. Overall, the results confirm that natural convection significantly increases the apparent thermal conductivity of the fluid core, thereby improving the overall heat transfer efficiency of the system.
The results show a clear inverse relationship between aspect ratio and effective thermal conductivity, indicating a decline in heat transfer efficiency as the enclosure becomes taller and narrower. At an aspect ratio of 1, the highest effective thermal conductivity of 14.29 W/m·K is observed, reflecting vigorous convective heat transfer driven by strong turbulence and fluid mixing. However, as the aspect ratio increases to 2, the conductivity drops sharply to 11.9 W/m·K, and further decreases to 0.461 W/m·K at aspect ratio 4, signifying a marked reduction in convective strength and a transition toward more stable, laminar-like flow.
The lowest value of 0.186 W/m·K occurs at aspect ratio 8, where heat transfer is minimally enhanced compared to pure conduction due to suppressed turbulence and the formation of thermally stratified layers. This trend highlights that higher aspect ratios limit lateral convection and reduce turbulent mixing, thus diminishing the effectiveness of convective transport despite the presence of buoyancy forces.
8.4. Contours of Streamline Distribution
A streamline is an imaginary line in a fluid flow field whose tangent at any point is parallel to the local velocity vector.
Figures 18 to 21 present streamline contours A streamline is an imaginary line in a fluid flow such that the tangent at any point aligns with the direction of the fluid velocity at that location. The streamline analysis reveals a significant decline in flow circulation strength with increasing aspect ratio.
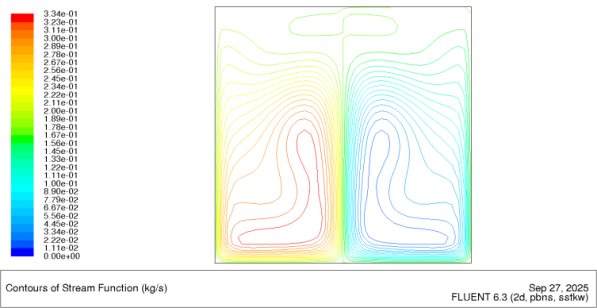
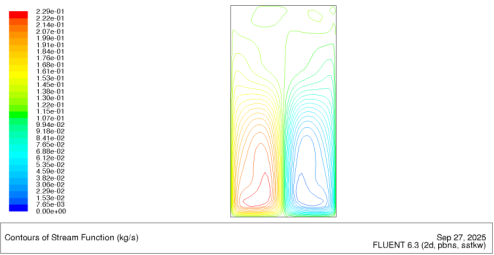
Figure 18. Contours of Streamlines for Aspect Ratio 1.
Figure 18 shows the streamlines for an aspect ratio of 1, illustrating a symmetric natural convection flow pattern within the enclosure. The streamlines form two distinct counter-rotating vortices, with hot fluid rising along the central region and cooler fluid descending near the sidewalls, establishing a stable circulation loop. The maximum stream function value of approximately 3.34 × 10⁻¹ kg/s is observed near the core of the vortices, indicating regions of strong fluid motion and enhanced convective activity. Near the bottom and top corners, the streamlines are closely packed, suggesting weaker circulation and reduced flow velocity. The overall symmetry of the flow about the vertical centerline confirms that the applied boundary conditions produce a balanced and steady buoyancy-driven convection structure characteristic of laminar natural convection at this aspect ratio.
The streamline distribution in
Figure 18 can be scientifically explained by the buoyancy-driven flow established due to the temperature difference between the heated bottom wall (320~K) and the cooled top wall (298~K). The heating at the bottom reduces the fluid density, causing it to rise through the central region, while the cooling at the top increases the density, resulting in the downward movement of fluid along the sidewalls. This opposing motion generates two symmetric counter-rotating vortices that maintain a steady convective circulation within the enclosure. The maximum stream function value of approximately {3.34 × 10⁻¹~kg/s} indicates regions of strong momentum transfer, where thermal and velocity gradients are most intense. The symmetry of the flow structure arises from the uniform thermal boundary conditions and the square geometry of the cavity. Overall, the observed pattern represents a stable laminar convection regime, where the interaction between buoyancy forces and viscous effects governs the flow behavior and heat transfer distribution.
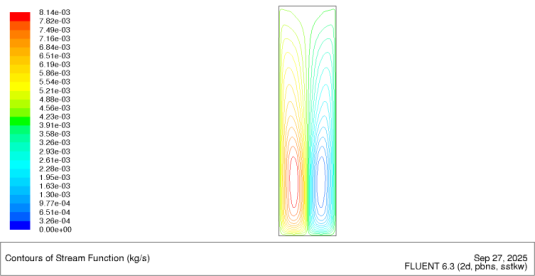
Figure 19. Contours of Streamlines suspect ratio 2.
In
Figure 19 The streamlines for aspect ratio 2 exhibit the formation of two distinct counter-rotating vortices that are symmetrically distributed along the vertical axis of the enclosure. The flow rises along the heated bottom wall, reaches the top region where it cools and descends along the colder upper surface, completing a closed circulation loop. The recirculation cells are relatively confined near the bottom due to the moderate aspect ratio, indicating limited vertical motion and stronger horizontal flow components near the heated surface. The symmetry and structure of the streamlines suggest a steady and stable convection pattern dominated by buoyancy forces, with minimal distortion or turbulence effects.
The Scientific explanation to the streamline distribution for aspect ratio 2, as shown in
Figure 19, reveals two well-defined and symmetric counter-rotating vortices formed due to buoyancy-driven flow within the cylindrical enclosure. The maximum stream function value is approximately
indicating the strength of circulation within the enclosure. The fluid near the heated bottom wall (at 320~K) experiences a decrease in density, causing it to rise due to buoyant forces. Upon reaching the upper region, the fluid cools down (at 298~K), becomes denser, and descends along the cooler side, completing a convective loop. The moderate aspect ratio (AR = 2) allows sufficient vertical space for the development of two distinct recirculation zones, each occupying half of the enclosure. The smooth and nearly symmetric streamline contours imply that the flow remains stable and predominantly laminar, with buoyancy effects dominating over inertial forces. The magnitude of the maximum stream function value also indicates an enhancement in fluid circulation intensity compared to AR = 1, reflecting improved convective heat transfer within the enclosure.
Figure 20. Contours of Streamlines for aspect ratio 4.
The streamlines for aspect ratio 4, as shown in
Figure 20, display two elongated counter-rotating vortices that are vertically stretched and occupy most of the enclosure’s height. The flow pattern shows reduced horizontal circulation and increased confinement near the bottom region, indicating weaker convective motion compared to lower aspect ratios. The upward and downward fluid movements are more restricted, and the streamlines appear closely packed along the vertical direction, suggesting a dominance of vertical stratification. Overall, the flow remains symmetric and stable, with reduced intensity of circulation due to the increased enclosure height.
The streamline distribution for aspect ratio 4, as presented in
Figure 20, indicates the formation of two elongated counter-rotating vortices that extend vertically throughout the enclosure. The maximum stream function value is approximately
which is significantly lower than that observed for aspect ratio 2, demonstrating a considerable reduction in circulation strength. This reduction occurs because the increased height of the enclosure suppresses horizontal fluid motion and enhances thermal stratification, leading to weaker buoyancy-induced recirculation. The fluid near the heated bottom wall (at 320~K) rises due to reduced density, but as it travels upward, the thermal driving force diminishes, and the flow loses momentum before reaching the top cooled region (at 298~K). Consequently, the flow becomes more confined and vertically oriented, showing a transition toward weaker convection. The nearly symmetric streamline structure confirms that the flow remains steady and dominated by buoyancy forces, but the overall intensity of natural convection decreases with increasing aspect ratio.
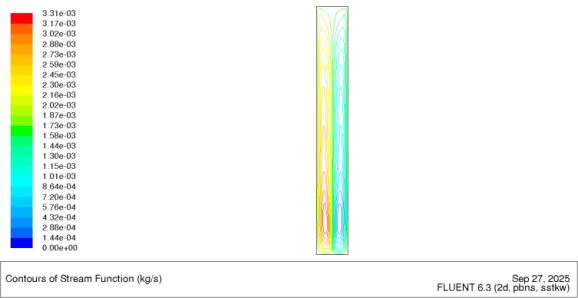
Figure 21. Contours of Streamlines for aspect ratio 8.
The streamlines for aspect ratio 8, as shown in
Figure 21, reveal the presence of two highly elongated and slender counter-rotating vortices that are confined near the lower region of the enclosure. The flow circulation appears significantly weakened, with very low stream function values indicating reduced convection intensity. The increased height of the enclosure restricts the vertical development of recirculating cells, leading to pronounced thermal stratification and minimal fluid mixing. The streamlines are densely packed along the vertical direction, reflecting a predominantly conduction-controlled regime with limited buoyancy-driven flow motion. Overall, the flow remains symmetric but exhibits very weak circulation due to the suppression of convective effects at high aspect ratios.
The streamline distribution for aspect ratio 8, as illustrated in
Figure 21, demonstrates two extremely elongated and slender counter-rotating vortices that are confined near the bottom region of the cylindrical enclosure. The maximum stream function value is
, which is substantially lower than the values observed for lower aspect ratios. This significant decrease indicates a drastic reduction in the intensity of natural convection as the enclosure height increases. The increase in aspect ratio enhances thermal stratification, reducing the temperature gradients responsible for buoyancy-induced motion. Consequently, the fluid near the heated bottom wall (at 320~K) rises only slightly before losing momentum, while the descending cooler fluid (at 298~K) exhibits weak downward motion. The overall flow pattern is characterized by diminished recirculation strength and dominance of conductive heat transfer. The narrow and vertically stretched streamlines confirm that buoyancy effects are insufficient to sustain strong convective loops at higher aspect ratios, leading to a stable but weak flow regime dominated by stratified layers.
The highest streamline magnitude is observed at aspect ratio 1, with a value of 0.34 kg/s, indicating strong convective flow. As the aspect ratio increases, the magnitude progressively decreases—0.229 kg/s at aspect ratio 2, 0.00814 kg/s at aspect ratio 4, and reaching a minimum of 0.00359 kg/s at aspect ratio 8. In
Figure 18, the flow exhibits large vortices formed around two central cores, with streamlines following circular paths that become increasingly distorted away from the center. By
Figure 21, the vortex cores reduce in size, reflecting diminished circulation strength.
8.5. Contours of Turbulence Intensity
Turbulence intensity, also known as the intensity of turbulence, is defined as the root-mean-square of the turbulent velocity fluctuations normalized by the mean velocity. It provides a quantitative measure of the level of chaotic motion in a flow field. The results show a progressive decrease in turbulence intensity with increasing aspect ratio, while the Rayleigh number remains constant.
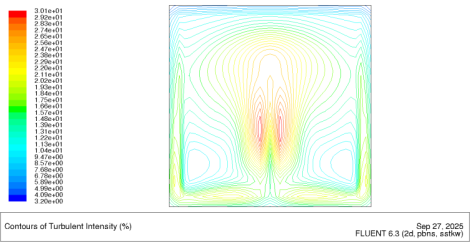
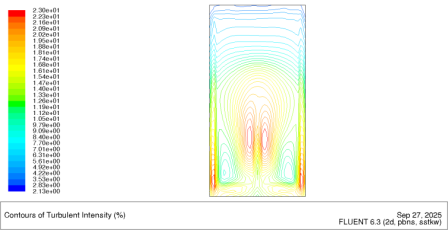
Figure 22. Contours of Turbulence intensity for Aspect Ratio 1.
In
Figure 22 the contours of turbulence intensity for Aspect Ratio 1 show that the highest turbulence levels are concentrated in the central vertical region of the enclosure, particularly near the bottom center where the flow impinges and recirculates upward. The distribution of turbulence is symmetric about the vertical centerline, indicating a balanced flow pattern within the domain. Lower turbulence intensity is observed near the enclosure walls and corners, while turbulence gradually decreases as the flow moves upward, resulting in more stable regions toward the top. Overall, the contour distribution suggests the presence of strong recirculation cells and localized mixing in the middle zone of the enclosure.
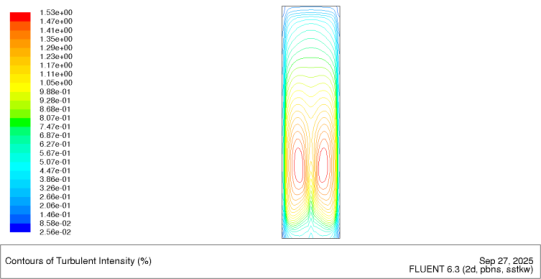
Figure 23. Contours of Turbulence intensity for Aspect Ratio 2.
At aspect ratio 1, the highest turbulence intensity is recorded at 30.1%, indicating the presence of strong turbulence and vigorous convective motion within the enclosure. This behavior can be attributed to the wider geometry, which allows greater lateral flow and promotes the formation of large-scale recirculation cells. These recirculation enhance velocity fluctuations and strengthen turbulent mixing, thereby increasing the overall turbulence intensity in the system. The elevated turbulence intensity contributes significantly to heat transfer by improving fluid mixing, thinning the thermal boundary layer, and facilitating the transport of thermal energy between the hot and cold regions of the enclosure. Consequently, the geometry at aspect ratio 1 not only promotes stronger flow circulation but also enhances the convective heat transfer performance.
The contours of turbulence intensity for Aspect Ratio 2 show that the highest turbulence levels are concentrated near the bottom central region of the enclosure. Compared to Aspect Ratio 1, the turbulence distribution appears more vertically stretched, following the elongated geometry of the domain. The high turbulence zones are confined close to the heated bottom surface, while the intensity decreases significantly toward the upper region, resulting in more stable flow near the top. The contours exhibit symmetry about the vertical centerline, and the overall pattern suggests elongated recirculation zones with weaker mixing in the upper regions of the enclosure.
As the aspect ratio increases to 2, the turbulence intensity drops significantly to 23%, indicating a notable reduction in turbulent activity compared to Aspect Ratio 1. Although the flow remains convective in nature, the elongated geometry alters the circulation pattern by restricting lateral fluid motion and confining recirculation cells closer to the heated bottom region. This reduction in lateral spreading weakens velocity fluctuations and suppresses large-scale turbulent structures that were more dominant at the lower aspect ratio. As a result, the flow exhibits weaker turbulent mixing and reduced momentum exchange between fluid layers.
The diminished turbulence intensity has direct implications for heat transfer performance within the enclosure. With weaker mixing, the thermal boundary layer remains comparatively thicker, reducing the rate of thermal energy transport from the hot surface toward the colder regions. Consequently, the overall efficiency of convective heat transfer declines, particularly in the upper part of the enclosure where turbulence intensity is lowest. The flow thus becomes more stratified, with stronger thermal gradients and less uniform temperature distribution compared to Aspect Ratio 1.
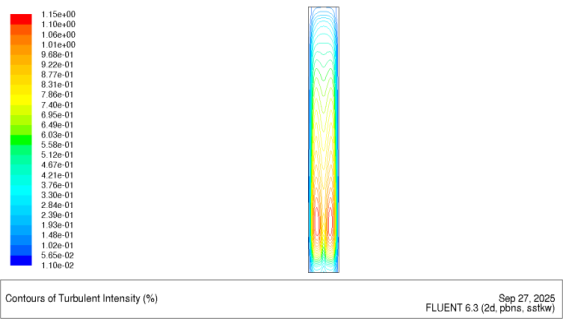
Figure 24. Contours of Turbulence intensity for Aspect Ratio 4.
In
figure 24 the contours of turbulence intensity for Aspect Ratio 4 indicate that turbulence levels are much lower compared to Aspect Ratios 1 and 2, with the highest values concentrated in small localized zones near the heated bottom surface. The distribution is highly elongated in the vertical direction, consistent with the tall and narrow geometry of the enclosure. Two symmetrical regions of higher turbulence are observed just above the heated base, while the upper portion of the enclosure exhibits very weak turbulence intensity. As the flow rises, turbulence rapidly diminishes, leading to stable and stratified flow conditions in the upper regions. The overall pattern suggests suppressed lateral motion, weaker recirculation cells, and minimal turbulent activity at higher elevations of the enclosure.
At aspect ratio 4, the turbulence intensity further decreases to 1.53%, indicating a drastic reduction in turbulent activity compared to lower aspect ratios. This low turbulence level suggests a transition toward a more organized and laminar-like convective regime, with minimal chaotic motion and limited vortex formation. The tall and narrow geometry severely restricts lateral flow development, thereby suppressing the formation of large-scale recirculation cells that were prominent at aspect ratio 1. Instead, the turbulence is confined to small localized regions near the heated bottom surface, while the upper sections of the enclosure remain largely stable and stratified.
The weakening of turbulence implies that velocity fluctuations and mixing are significantly reduced, which directly affects the efficiency of convective heat transfer. With less turbulent mixing, the thermal boundary layer near the heated wall remains relatively thick, slowing down the transport of thermal energy toward the colder regions of the enclosure. This results in a less uniform temperature distribution, with stronger vertical stratification and higher thermal gradients in the fluid domain. Consequently, the heat transfer performance at aspect ratio 4 is considerably lower, as the system shifts away from turbulence-driven convection toward a more diffusion-dominated regime.
Figure 25. Contours of Turbulence intensity for Aspect Ratio 8.
At aspect ratio 8, the turbulence intensity decreases even further to an almost negligible value of 1.15%, clearly signifying the dominance of a highly organized and stratified flow regime. In this tall and extremely narrow geometry, lateral fluid motion is almost completely suppressed, preventing the development of recirculation cells or vortical structures that are essential for turbulent mixing. The flow within the enclosure becomes predominantly unidirectional and laminar-like, with convection driven mainly by buoyancy forces in a vertical manner rather than through turbulent fluctuations.
This suppression of turbulence has profound implications for heat transfer. With velocity fluctuations nearly absent, the capacity of the flow to disrupt and thin the thermal boundary layer is drastically reduced. As a result, heat transfer becomes largely diffusion-controlled, with buoyancy-induced motion playing only a minor role in transporting thermal energy between the hot and cold surfaces. The temperature distribution within the enclosure thus becomes highly stratified, with steep vertical gradients and limited mixing between layers. Consequently, the convective heat transfer efficiency at aspect ratio 8 is the weakest among the geometries considered, reflecting the transition from vigorous turbulence-driven convection at low aspect ratios to a stable, diffusion-dominated regime at very high aspect ratios.
A comparison of the turbulence intensity across the four aspect ratios reveals a clear trend of diminishing turbulent activity and weakening convective heat transfer as the aspect ratio increases. At aspect ratio 1, the turbulence intensity reaches 30.1%, characterized by strong turbulence, vigorous recirculation, and enhanced mixing, which significantly promotes convective heat transfer. Increasing the aspect ratio to 2 reduces the turbulence intensity to 23%, as the elongated geometry limits lateral motion and weakens large-scale vortices, resulting in reduced mixing and a corresponding decline in heat transfer performance. At aspect ratio 4, the turbulence intensity drops sharply to 1.53%, indicating a transition toward a more organized and less chaotic flow regime with minimal vortex formation; as a result, convection weakens and stratification becomes more pronounced. Finally, at aspect ratio 8, turbulence intensity is almost negligible at 1.15%, reflecting a nearly laminar and diffusion-dominated regime where lateral circulation is suppressed, mixing is absent, and convective heat transfer efficiency is at its lowest.
Overall, the progression demonstrates that wider geometries (low aspect ratios) enhance turbulence and heat transfer, while taller and narrower geometries (high aspect ratios) suppress turbulence, leading to stable, stratified flows with poor thermal transport.
 values ranging from 0.1 to 0.225, the cylinder's position was altered from concentric to eccentric along the horizontal and vertical medians as well as the diagonal of the enclosure. The simulations were conducted under non-Boussinesq conditions, with the cylinder surface modeled using the Immersed Boundary Method. The results showed that at lower R/L values, the intensity of the chimney effect---strongly dependent on the Rayleigh number---was the dominant factor determining the optimal cylinder position along the horizontal median. For R/L values greater than 0.175, enhanced heat conduction with the vertical wall led to increased heat transfer when the cylinder was positioned closest to the vertical wall.


 and
and 